- Home
- About Pixie
- Installing Pixie
- Using Pixie
- Tutorials
- Reference
The Network Flow Graph script displays a graph of the pods, services or namespaces that talk to the specified IP address(es).
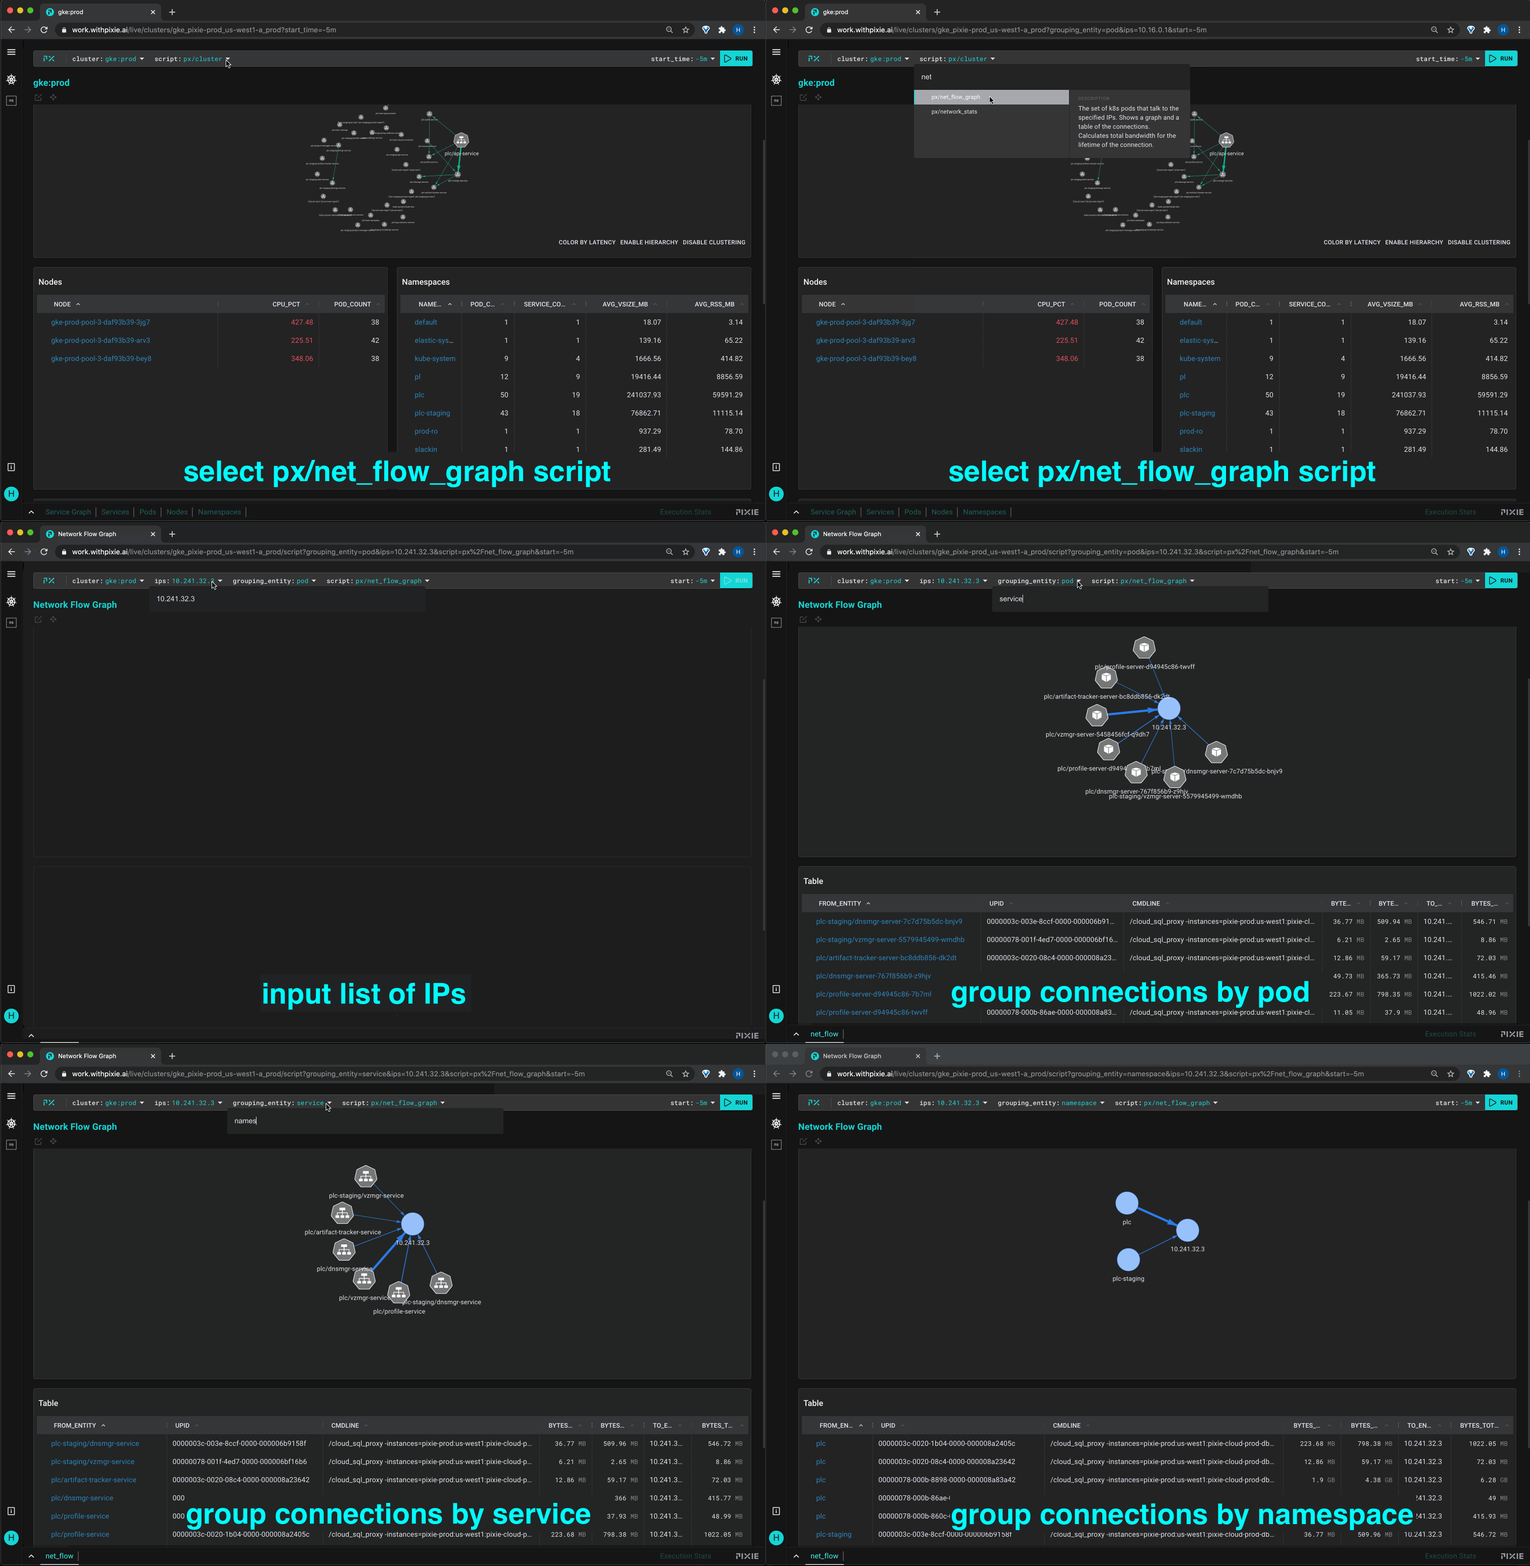
Pixie's auto-instrumentation platform can get fairly detailed information about HTTP, gRPC and other supported protocols. But there’s also a lot of traffic that we don’t yet support at a protocol capture level. This script provides basic network visbility for unsupported protocols, like CouchDB.
If your protocol is supported by Pixie, then it is better to use one of the protocol-aware Pixie scripts, as those scripts are able to track QPS, latency, and error rate for specific protools. Without protocol awareness, Pixie onlys track throughput and number of connections.
Here are a few use-cases for this protocol-blind script:
- For a very high-level overview of which services communicate with each other
- Determining which services talk to an unsupported database (e.g. MongoDB, Redis, Kafka)
- Determining which services talk to a third-party API endpoint (e.g. Stripe)
Pixie (>= v0.4.0) needs to be installed on your Kubernetes cluster. If it is not already installed, please consult our install guides.
Steps to run the script:
- Open up Pixie's Live UI and select your cluster.
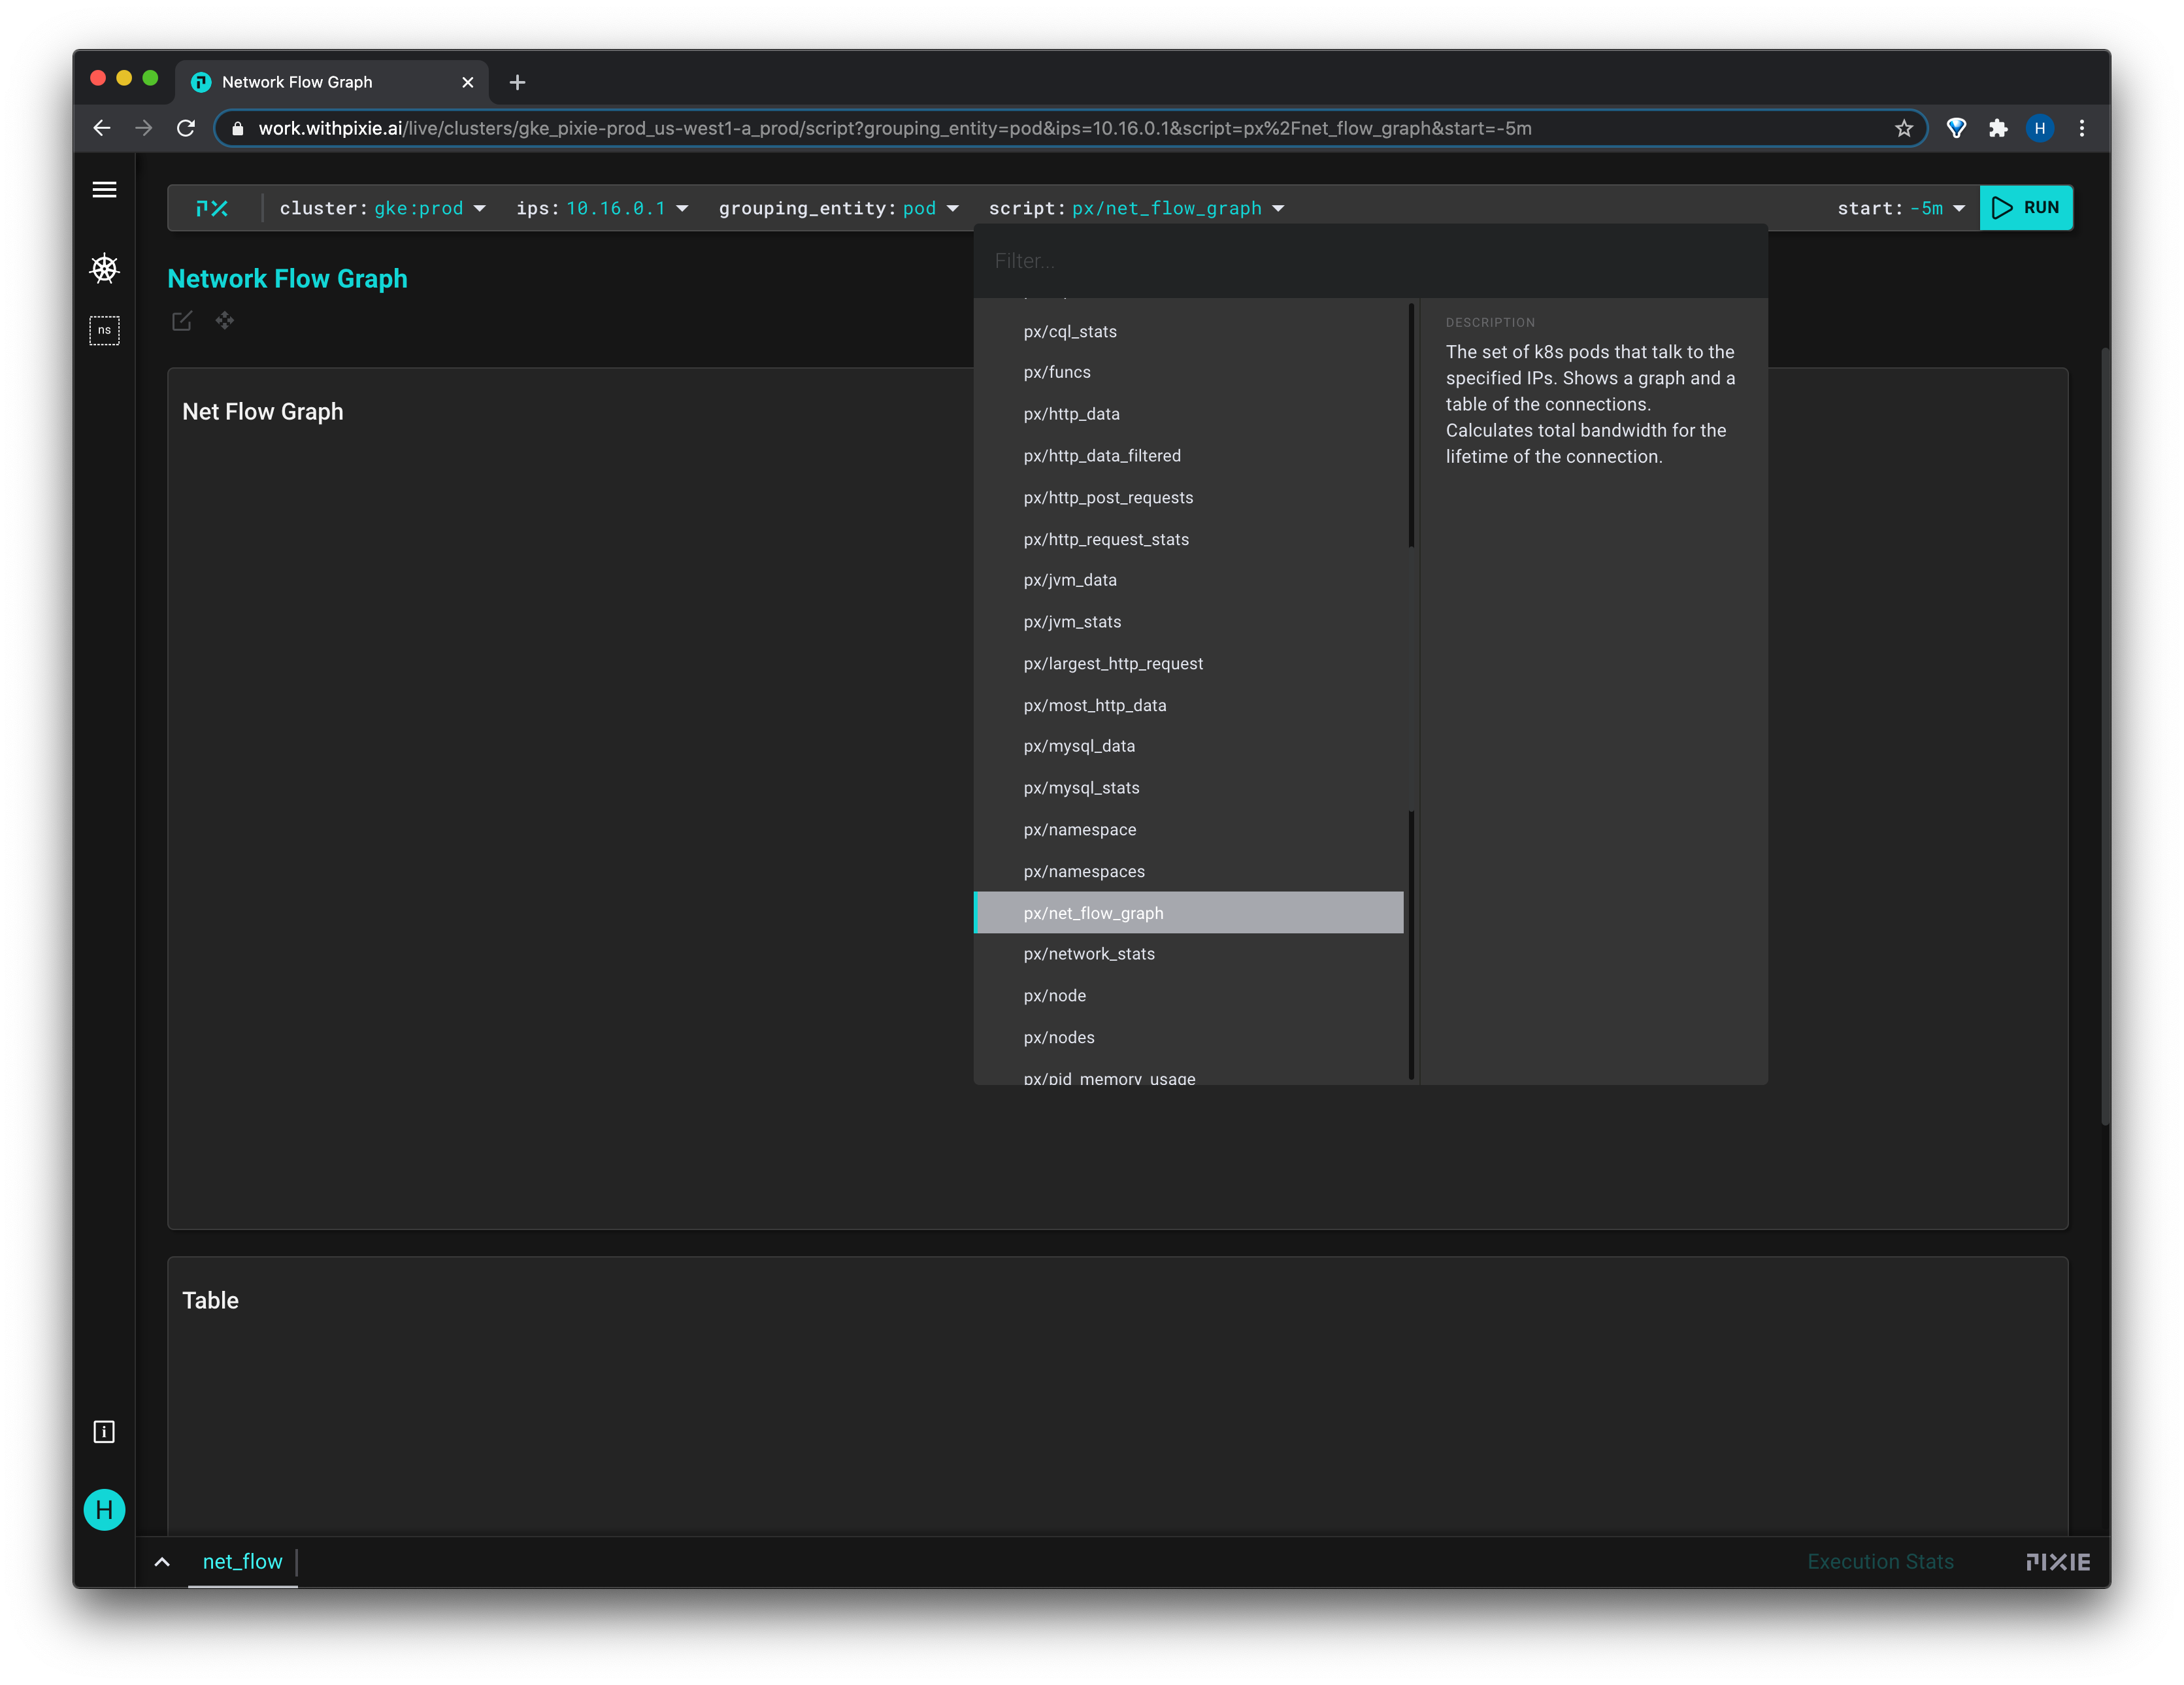
- Select the
px/net_flow_graphscript using the drop down menu or with the Pixie Command button (cmd/ctrl+kkeyboard shortcut).
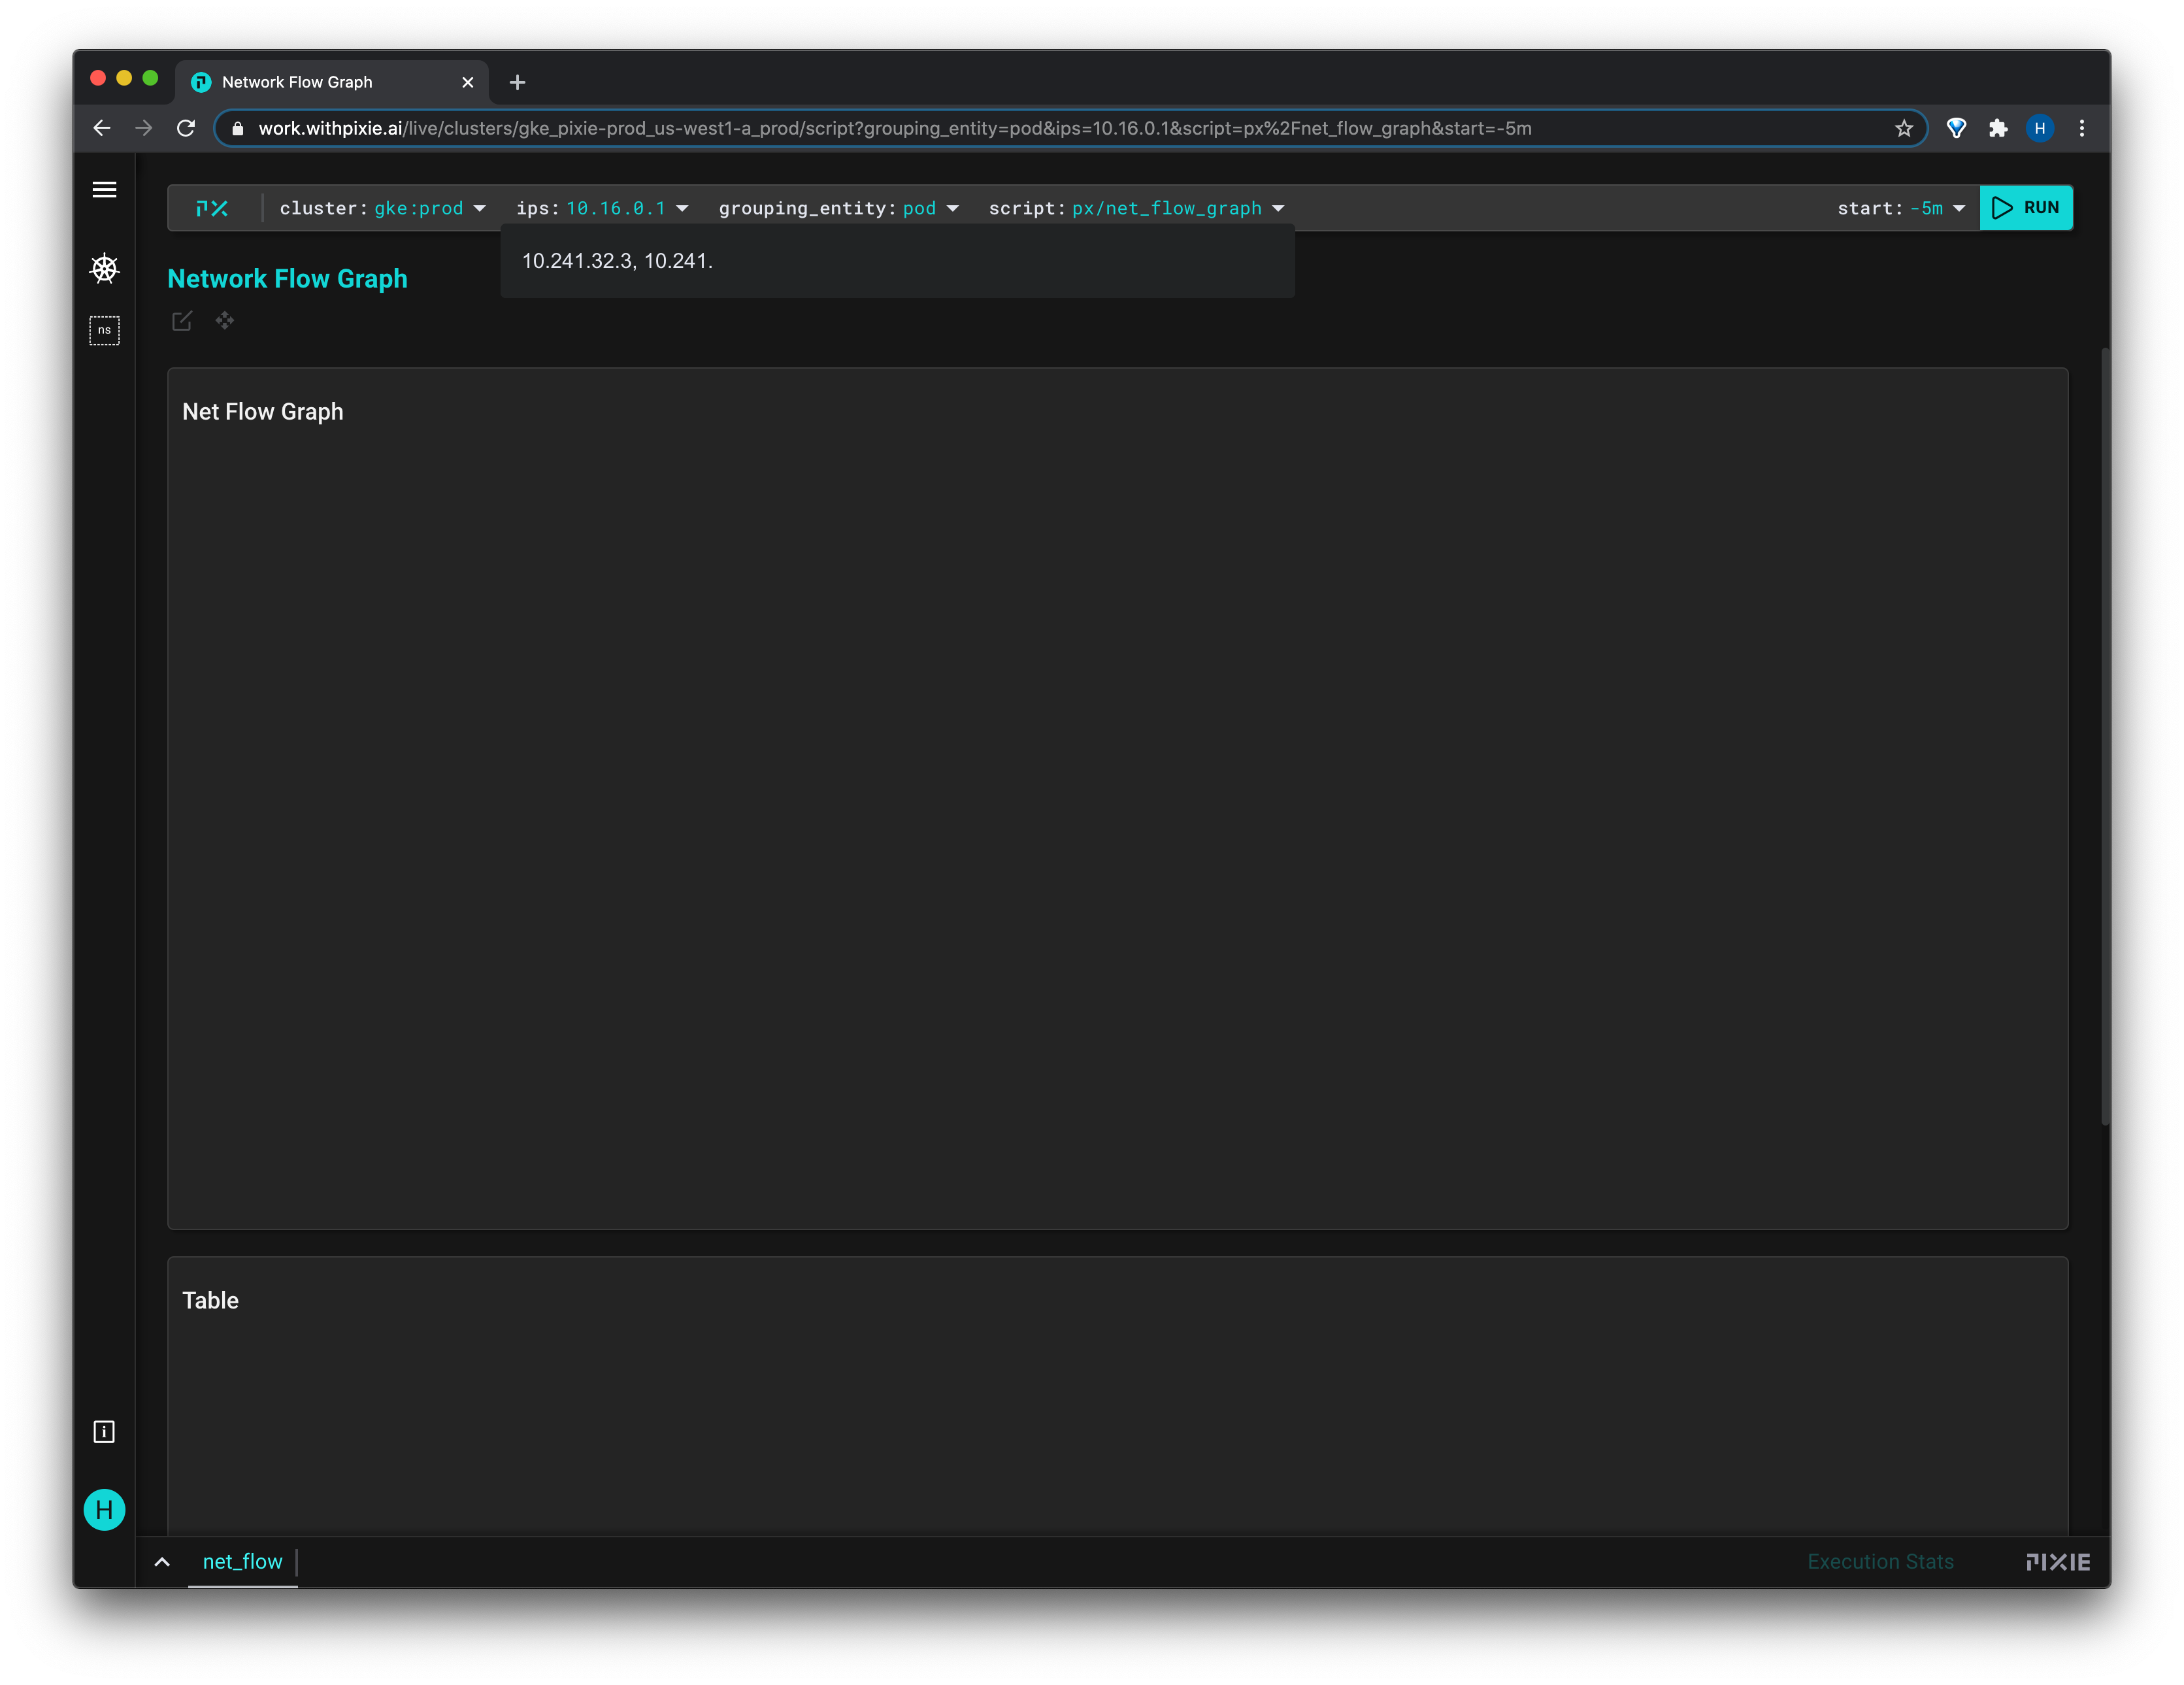
- This script requires a comma-separated list of hardcoded IP addresses. You can type one or more IPs into the
ipsvariable drop-down menu.
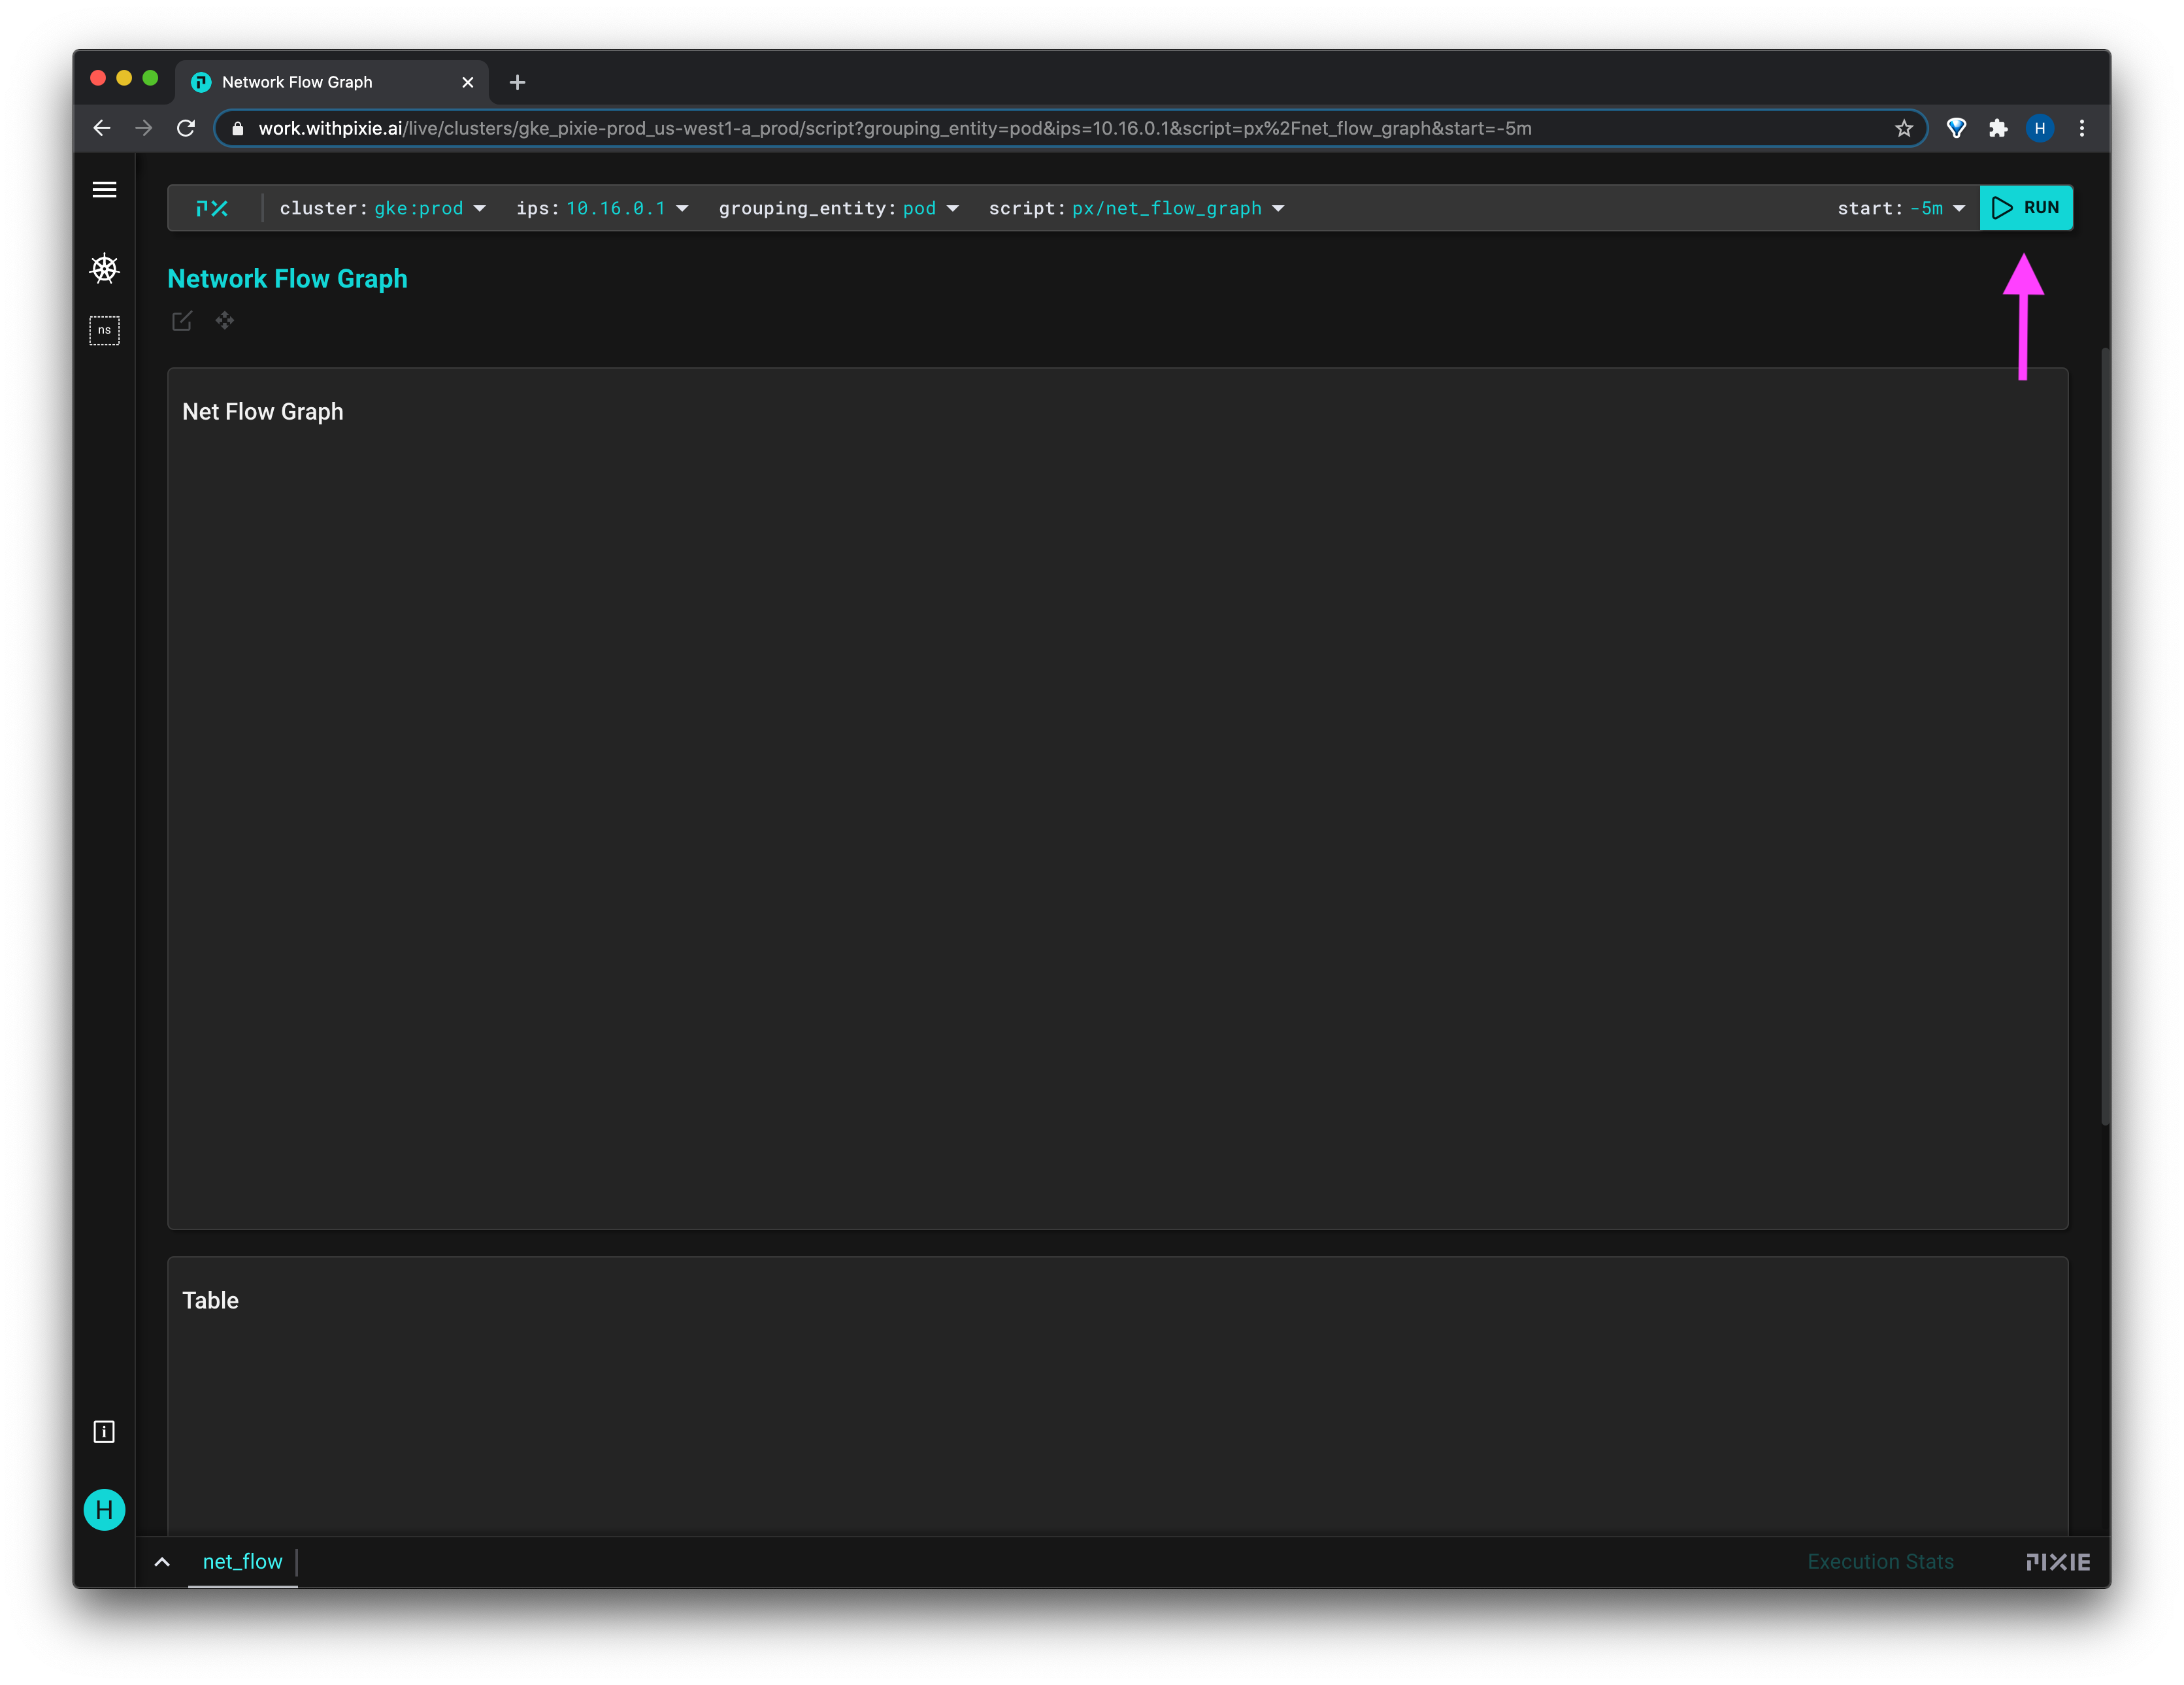
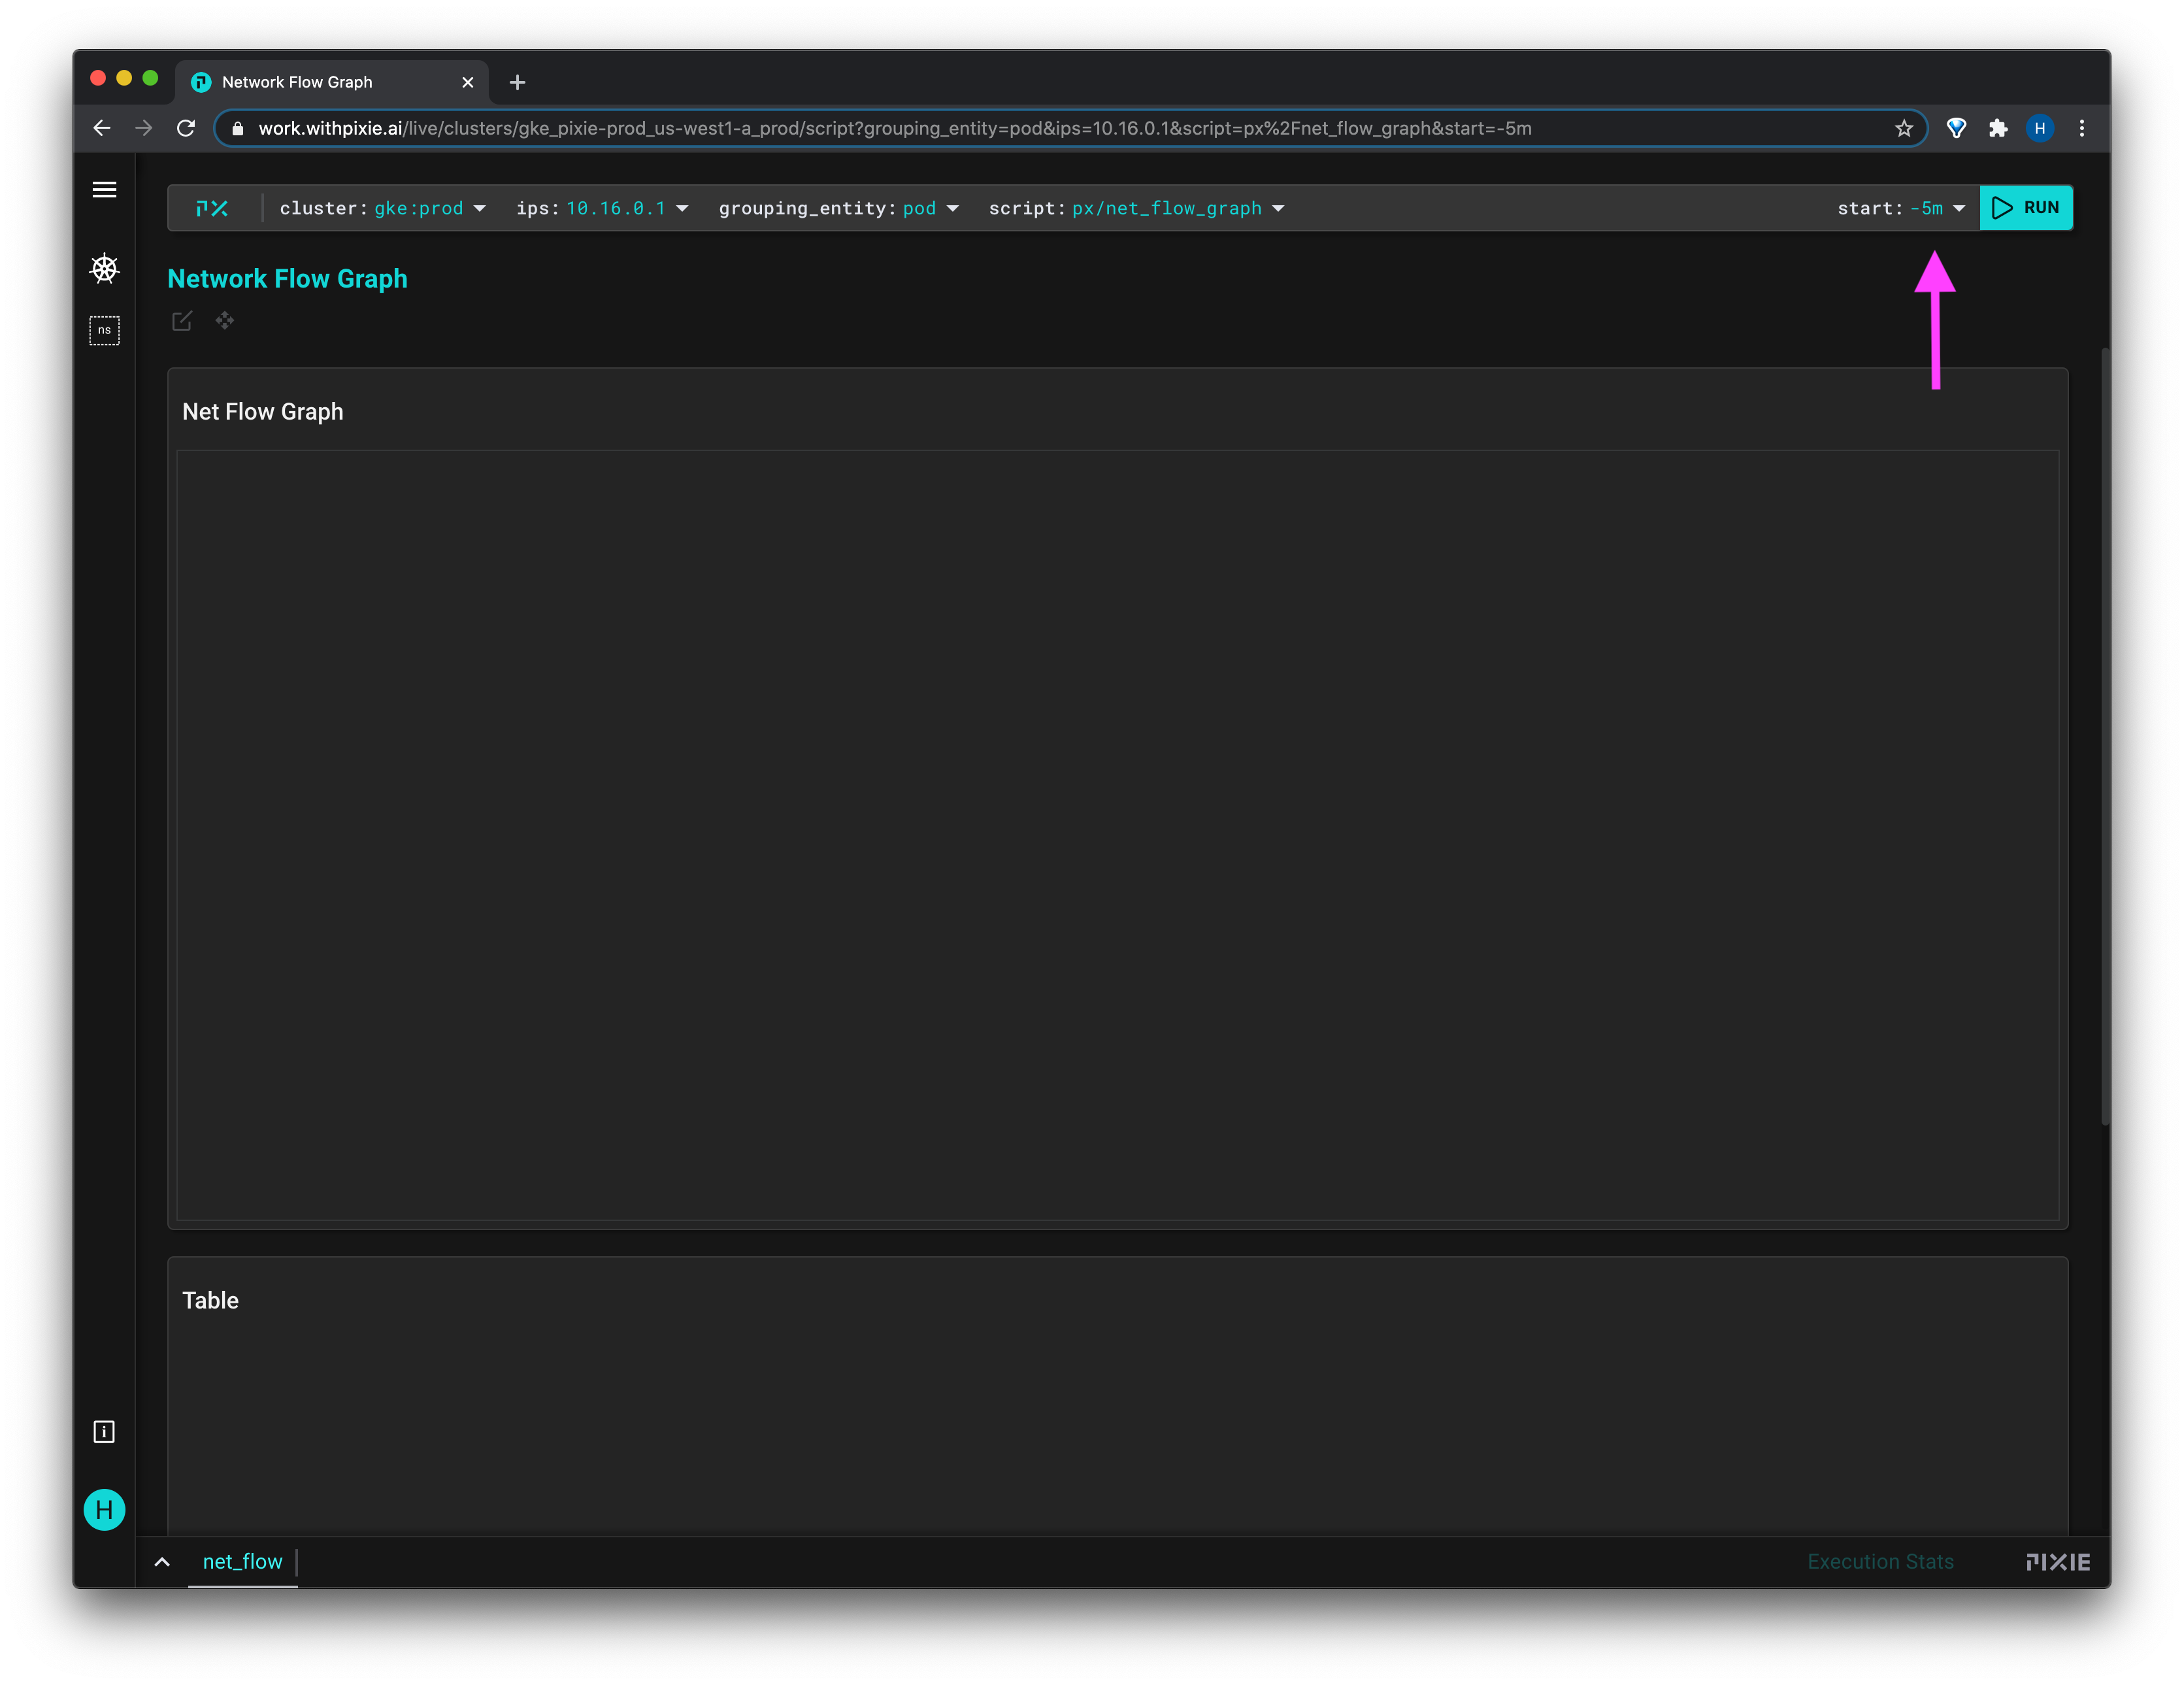
- To run the script, press the run button in the top-right or use the
cmd/ctrl+enterkeyboard shortcut.
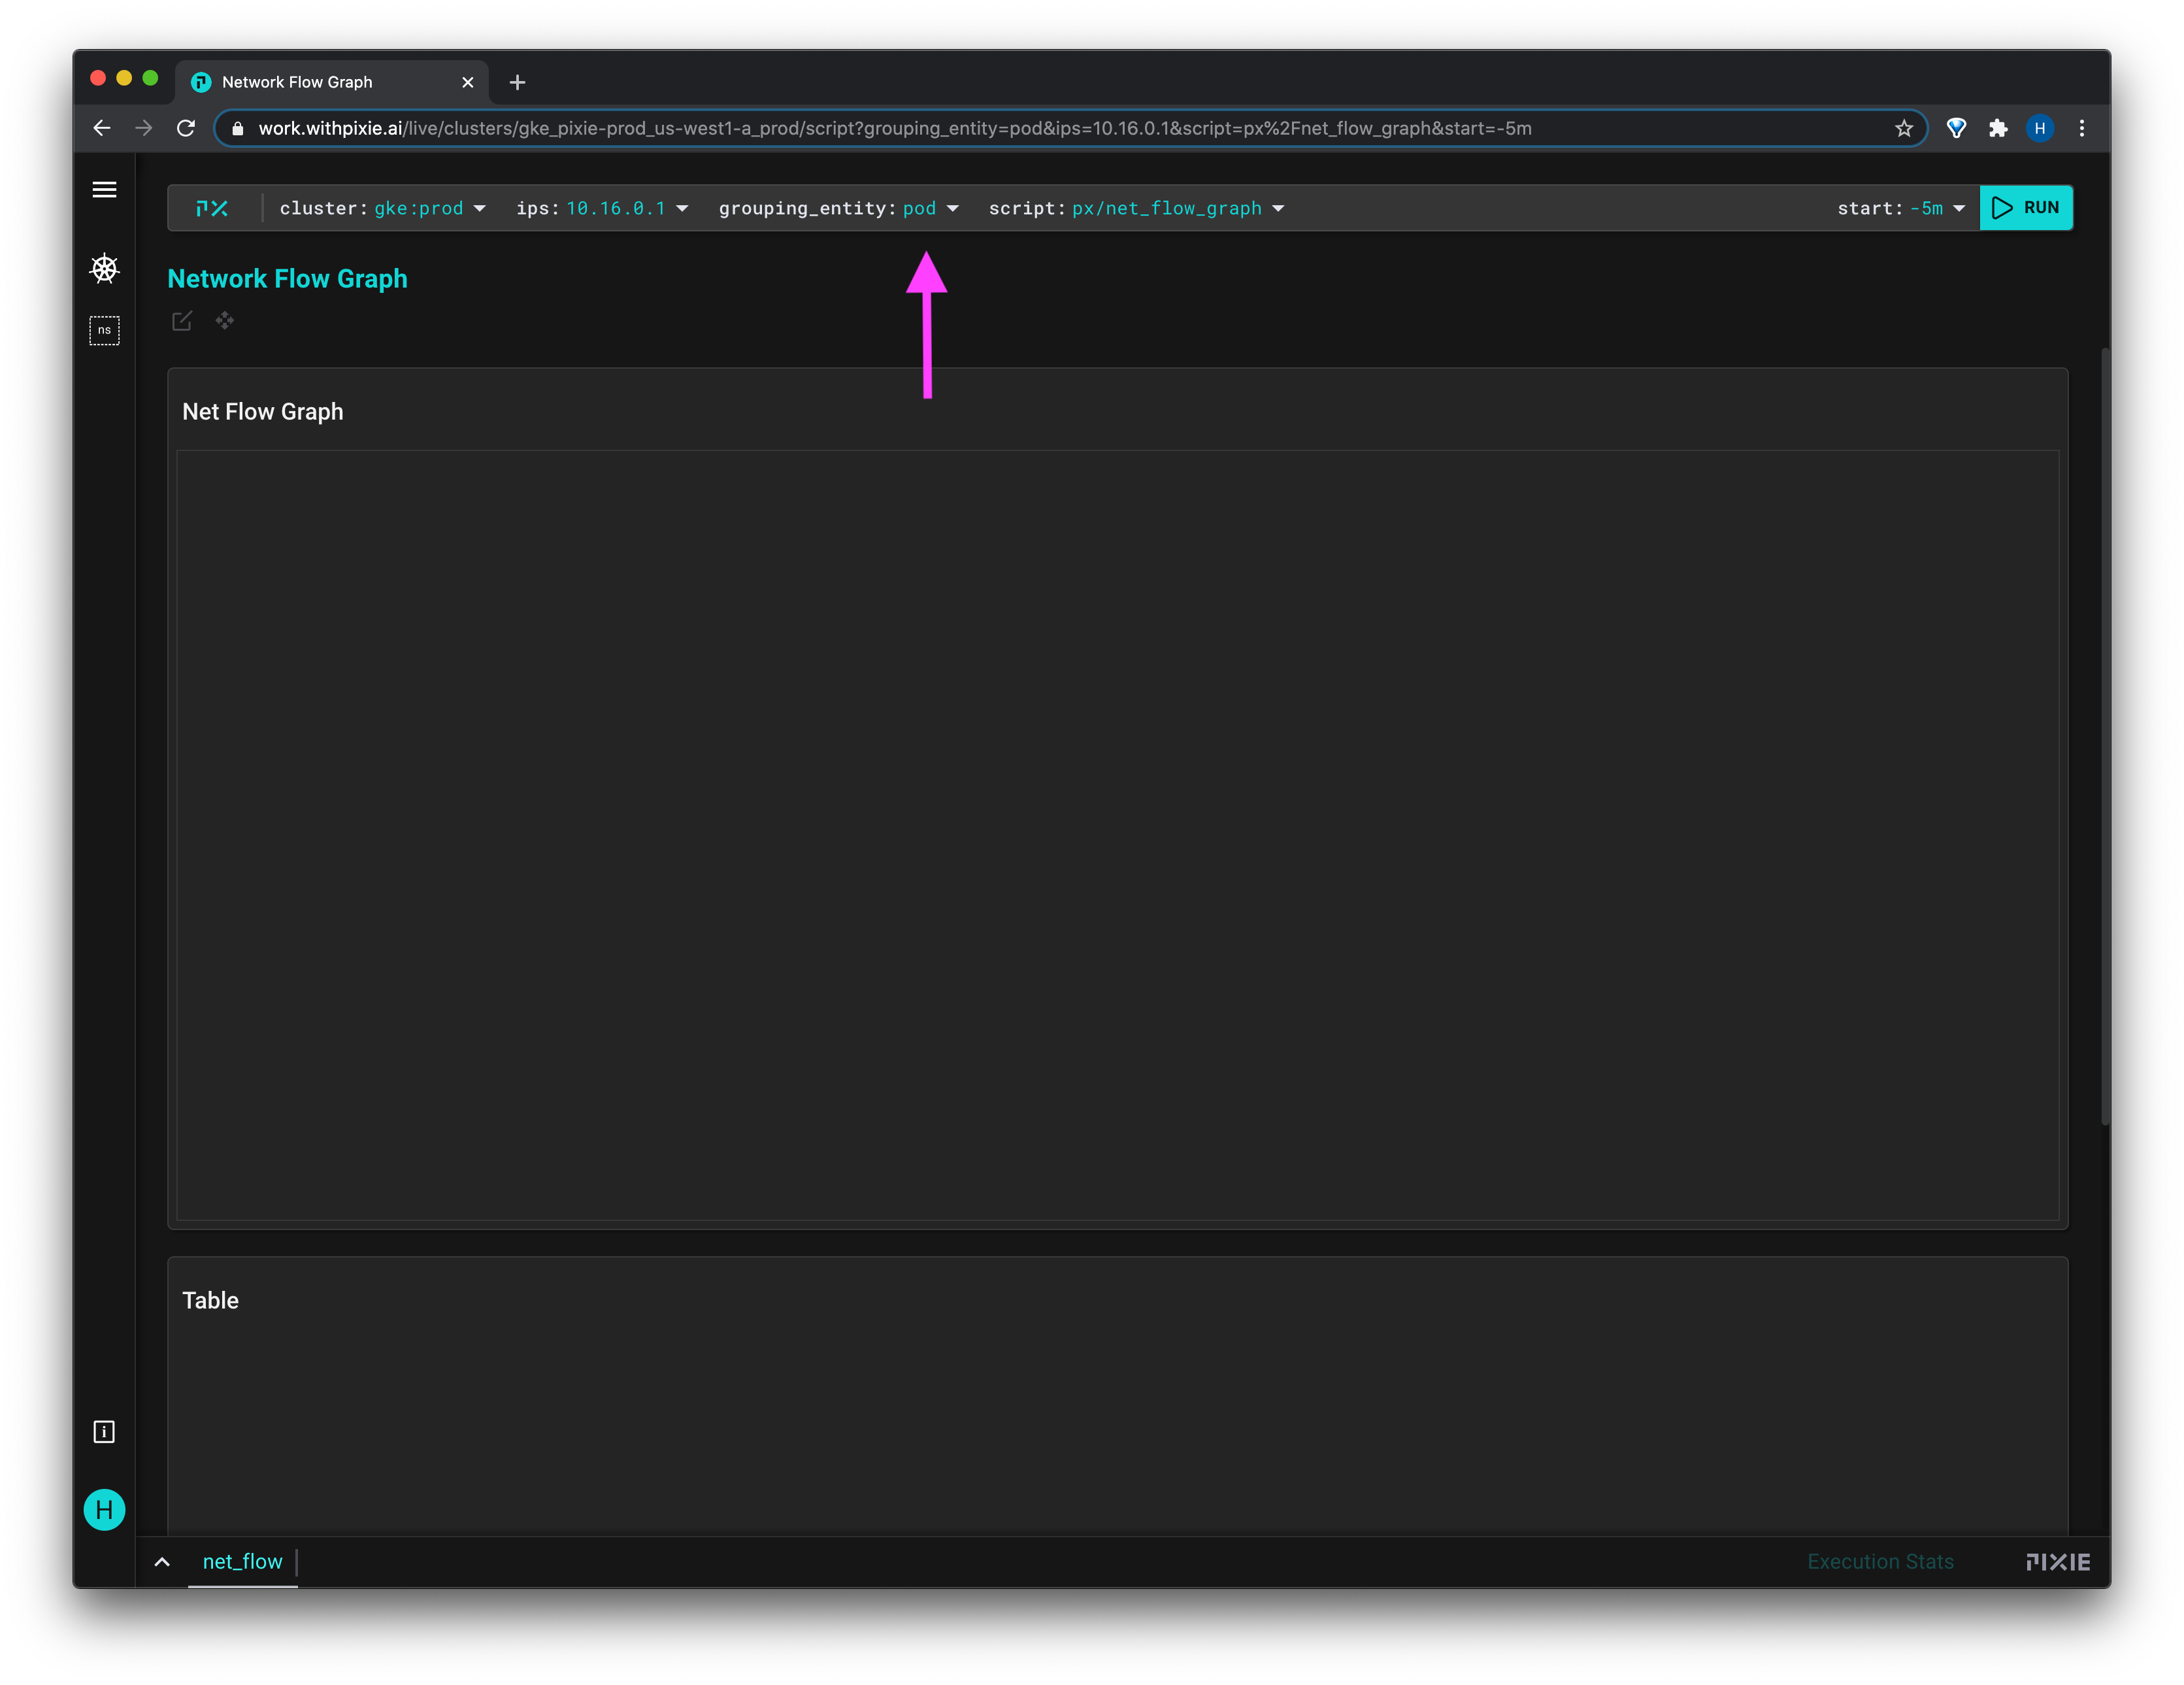
- To group the network connections, enter
namespace,serviceorpodinto thegrouping_entityvariable drop-down menu.
- To change the time window for which to display results, modify the
startvariable.
Once the script has run, the Live View window will show the graph of entities (namespaces, services or pods) that talk to the specified IP(s).
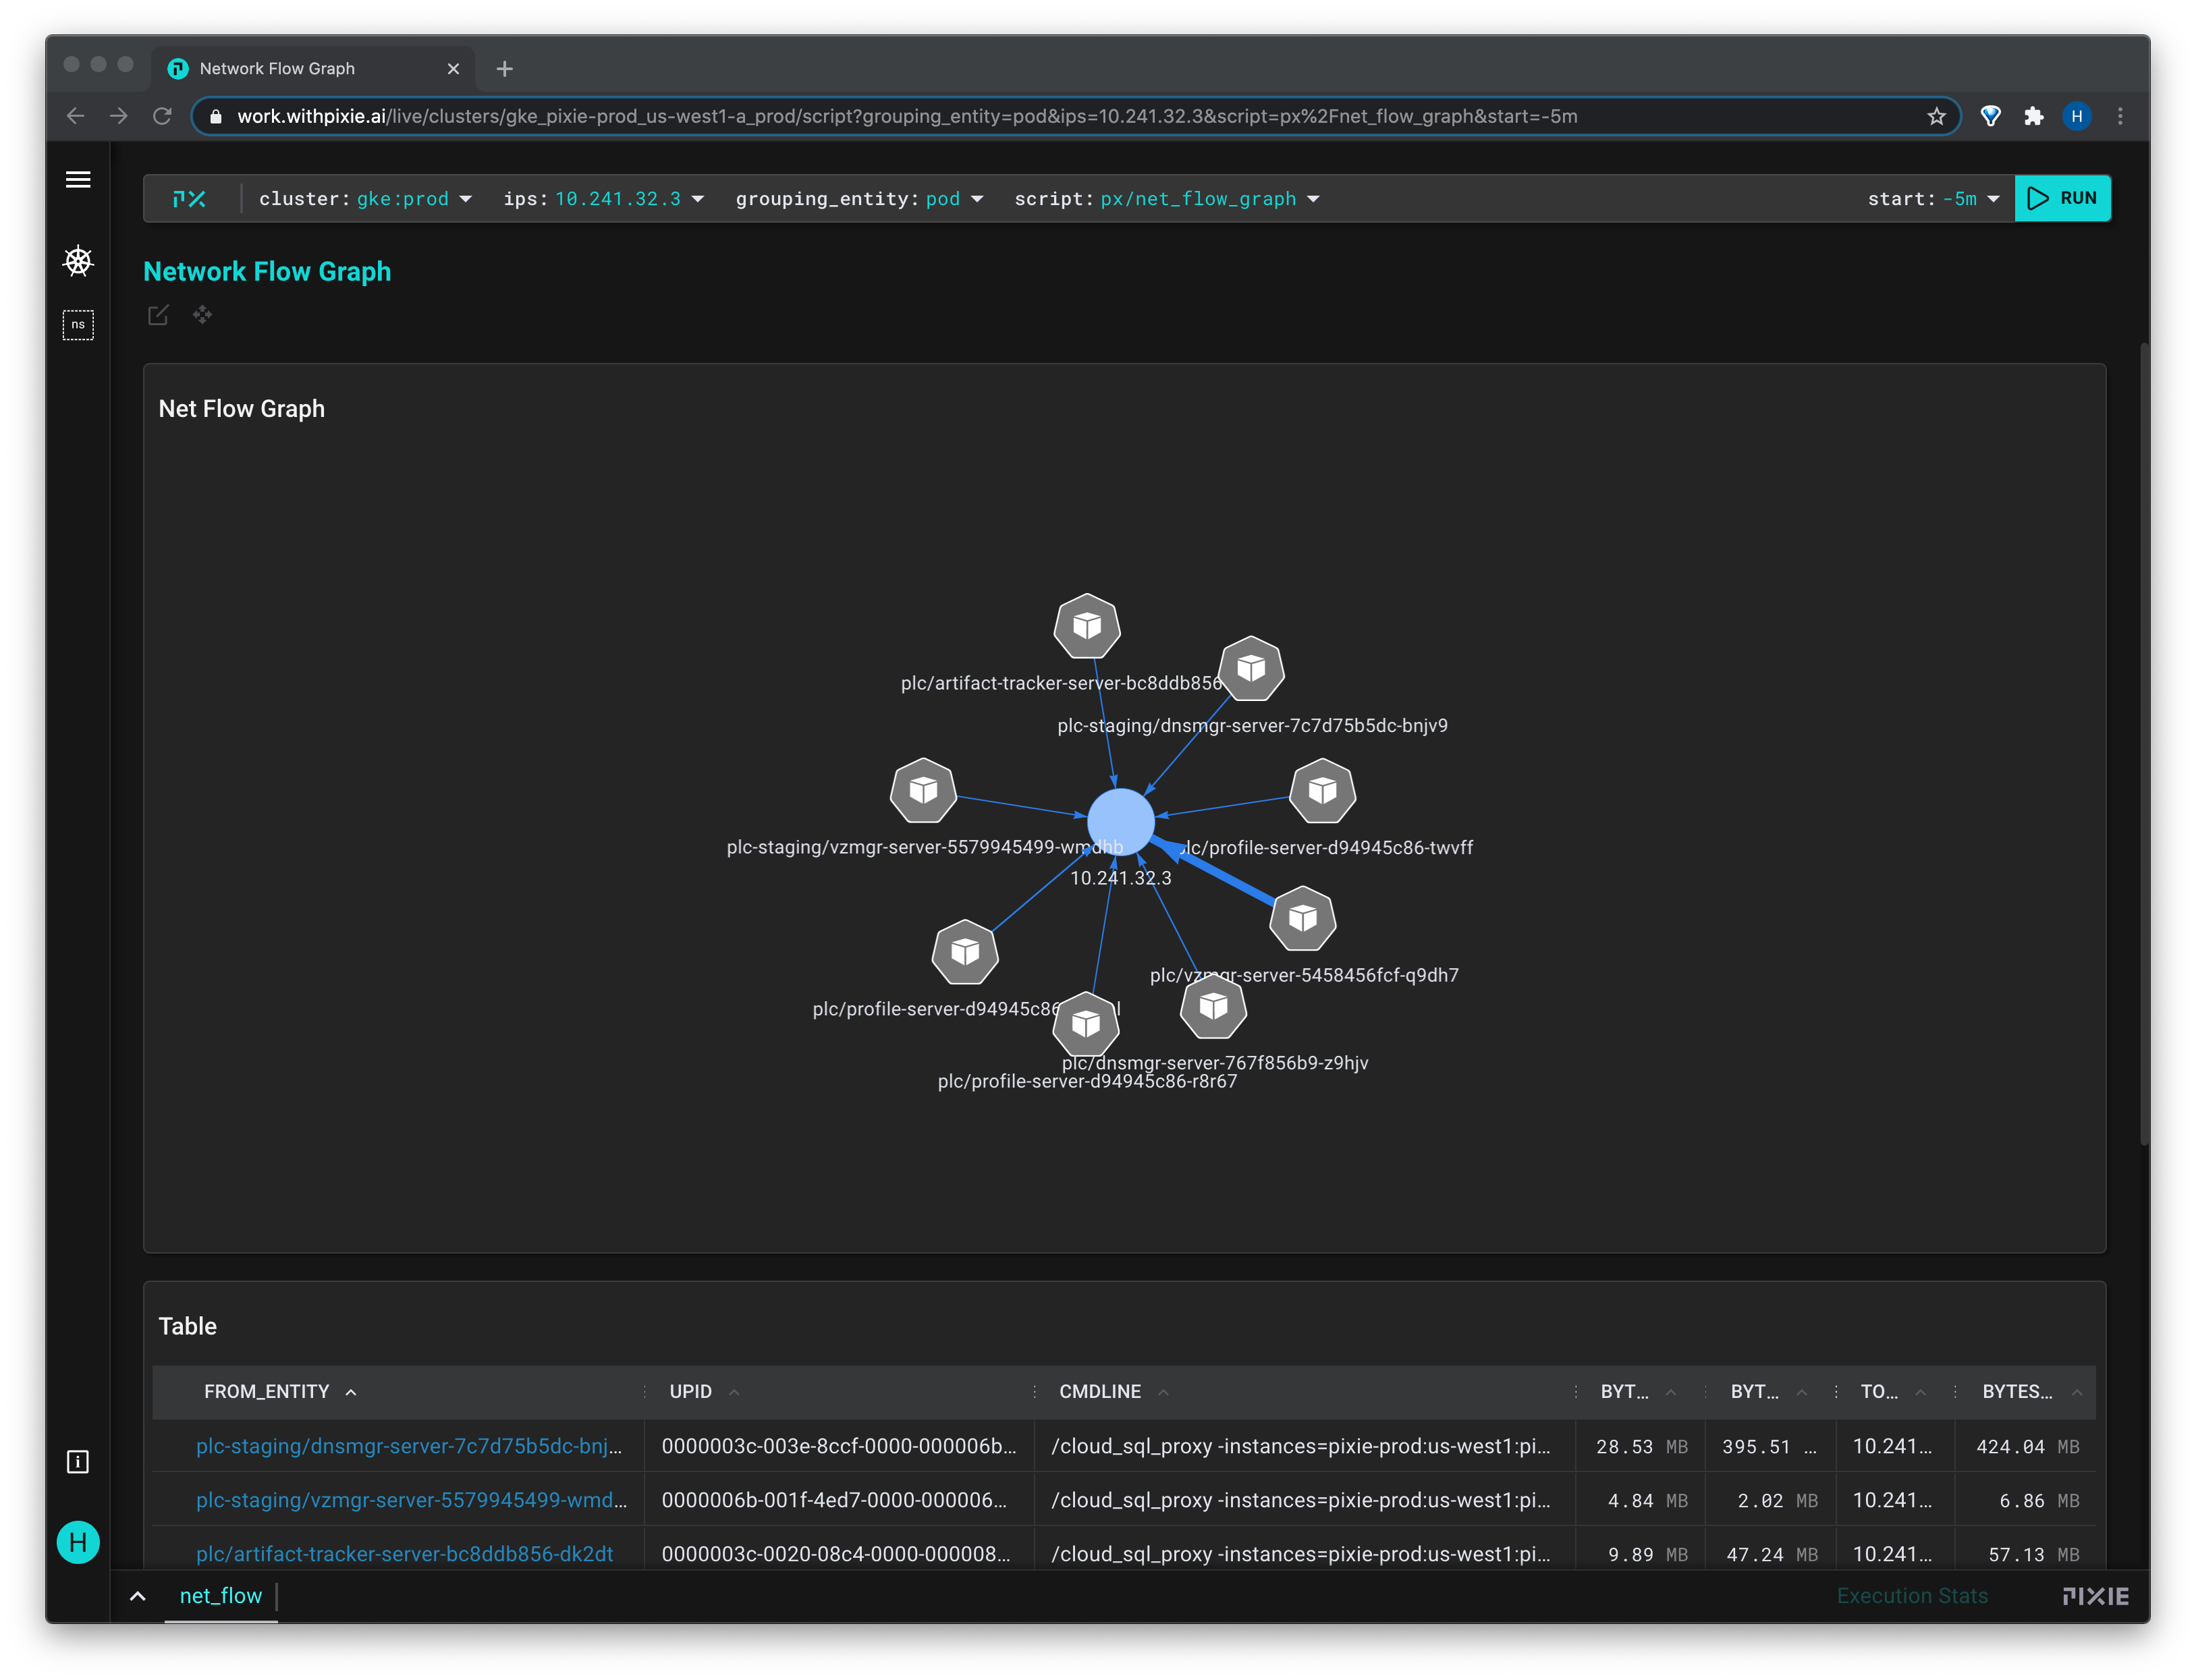
The thickness of the line between the service and the specified IP(s), represented by the blue circle, indicates more network traffic. Hover over this line to see the traffic stats.
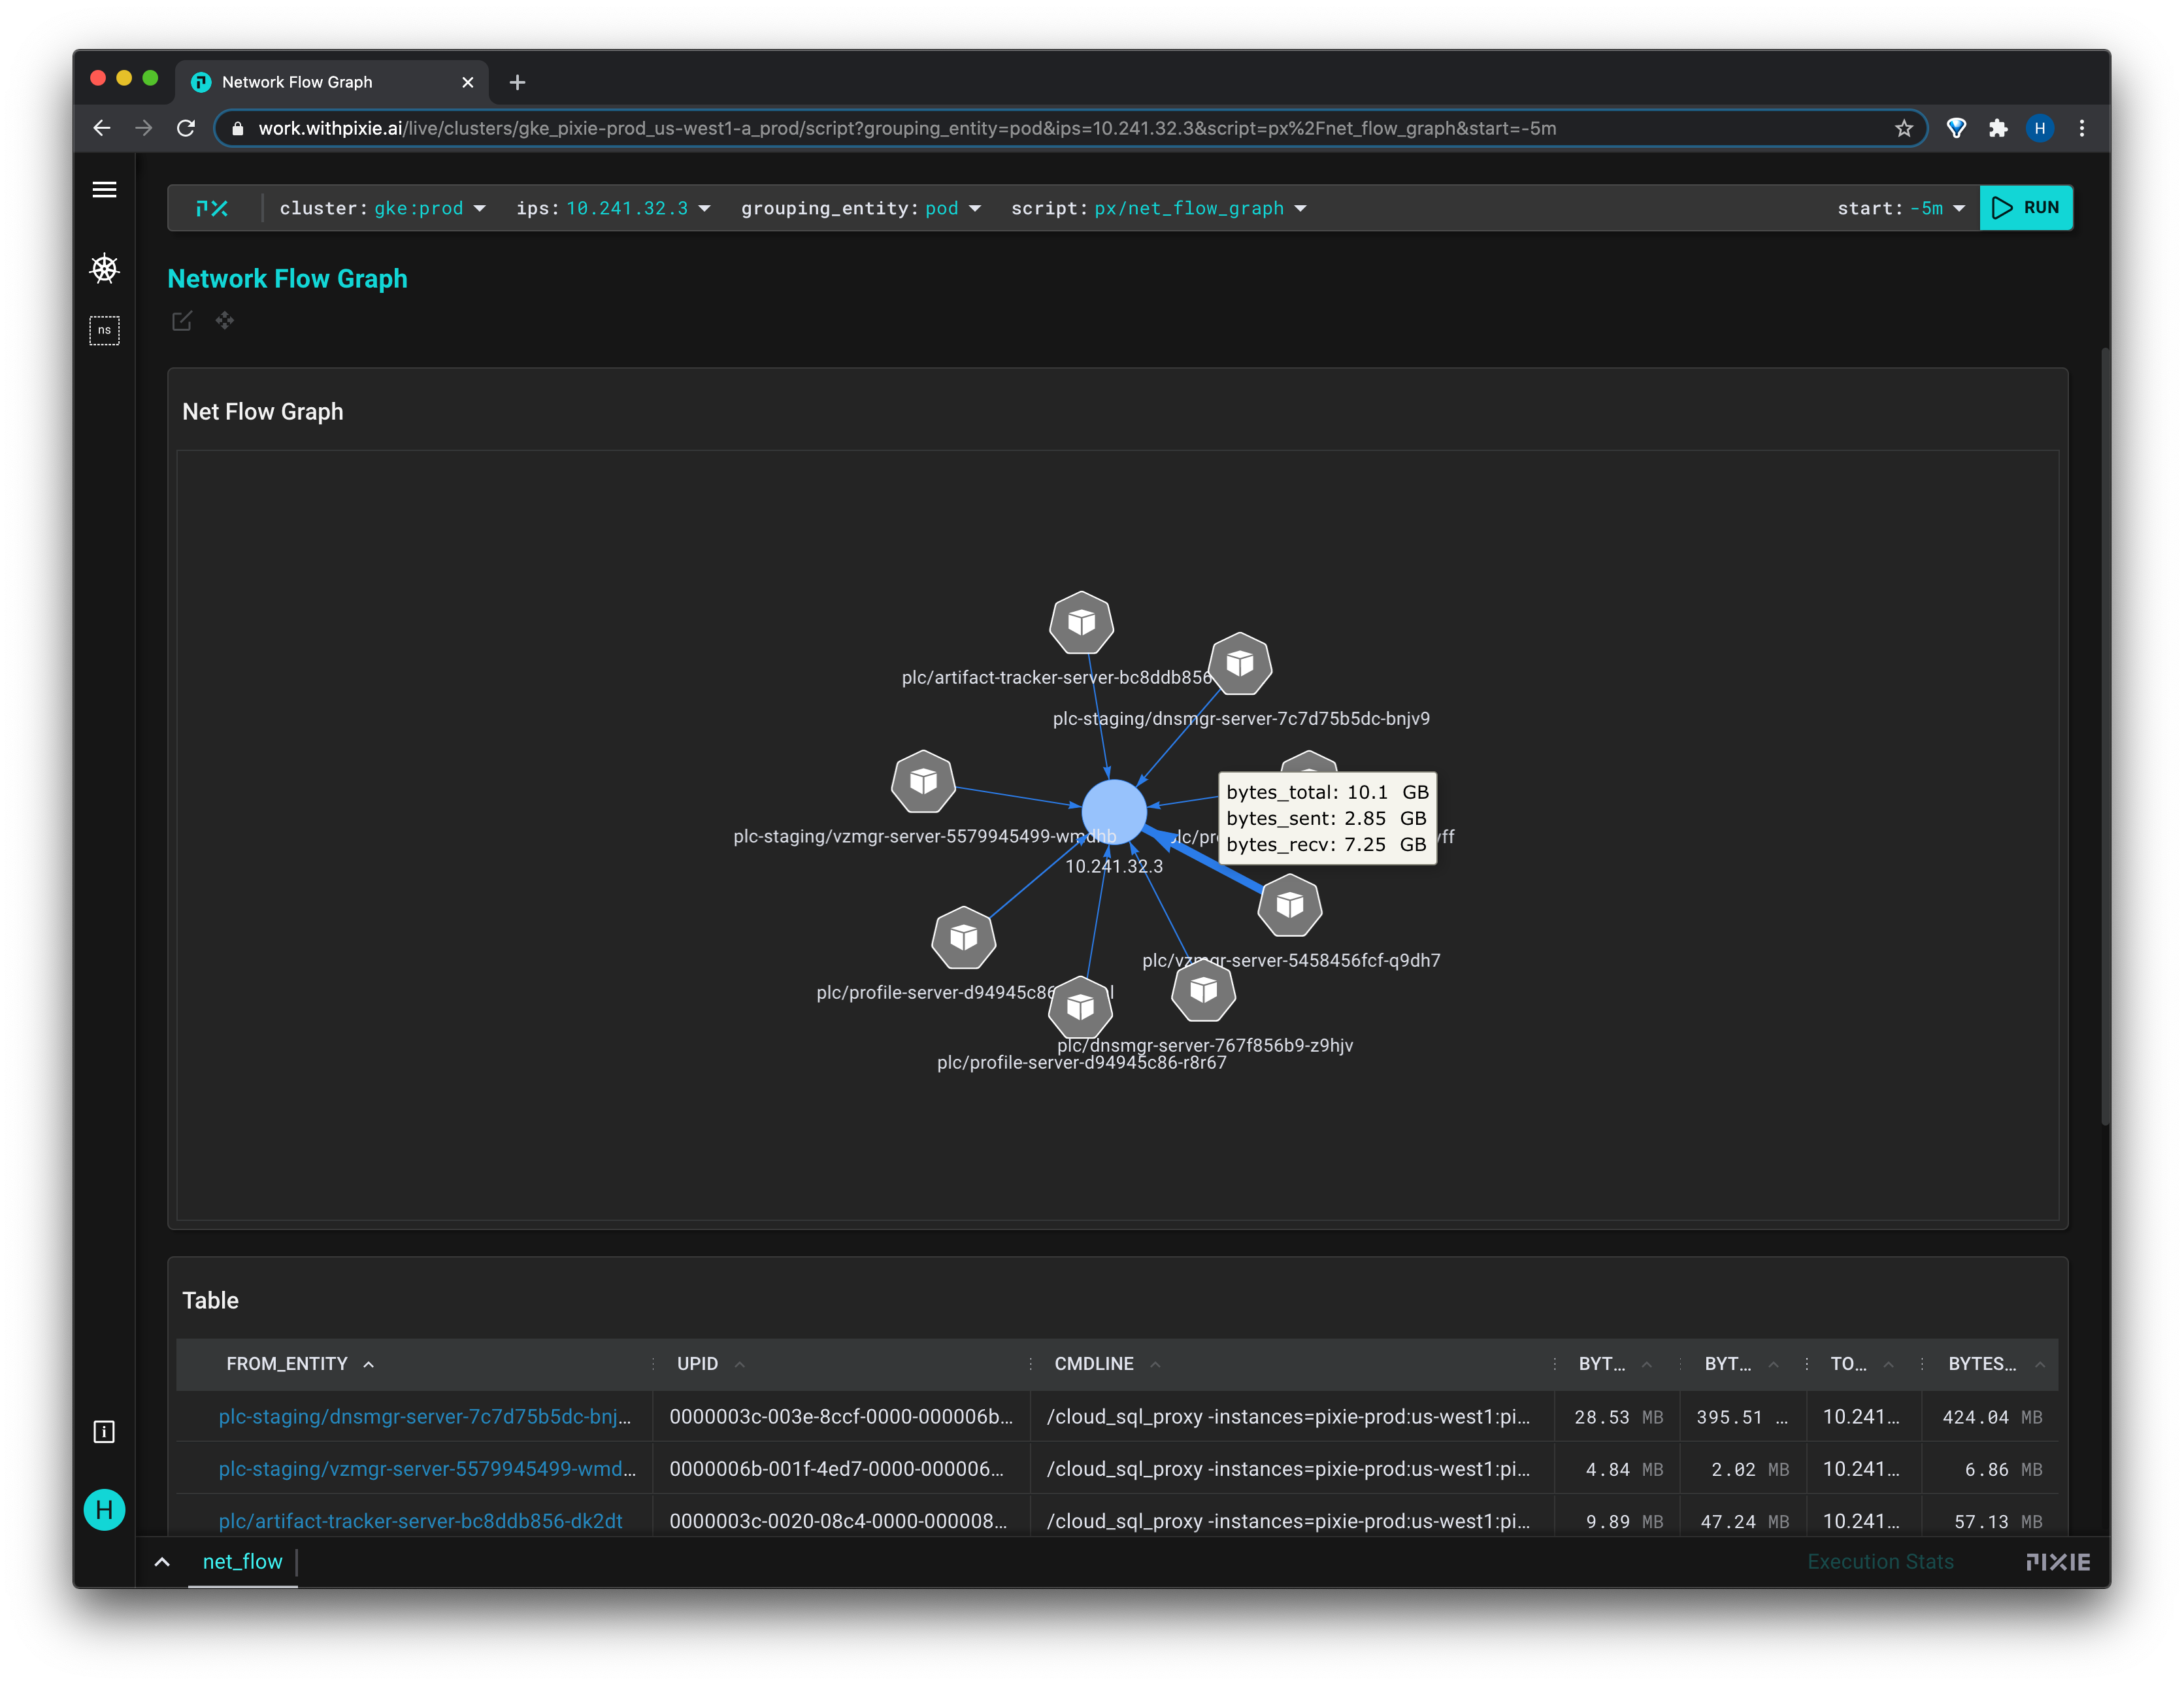
The traffic stats are also available in the table below the graph, along with the process that initiated the communication to the IP, and the total bandwidth for the lifetime of the connection.
Back in the graph, click on the pod (or namespace, service) to see a different Live View containing more information on that particular entity.
For a higher-level view showing just the namespaces that communicate with the specified IP(s), set grouping_entity variable to namespace.
For a complete walkthrough of the motivation behind this script and how to run it:
You can read and modify the source code for any script using the editor in the Live UI. Open and close the editor using the editor button or with the cmd/ctrl+e keyboard shortcut.
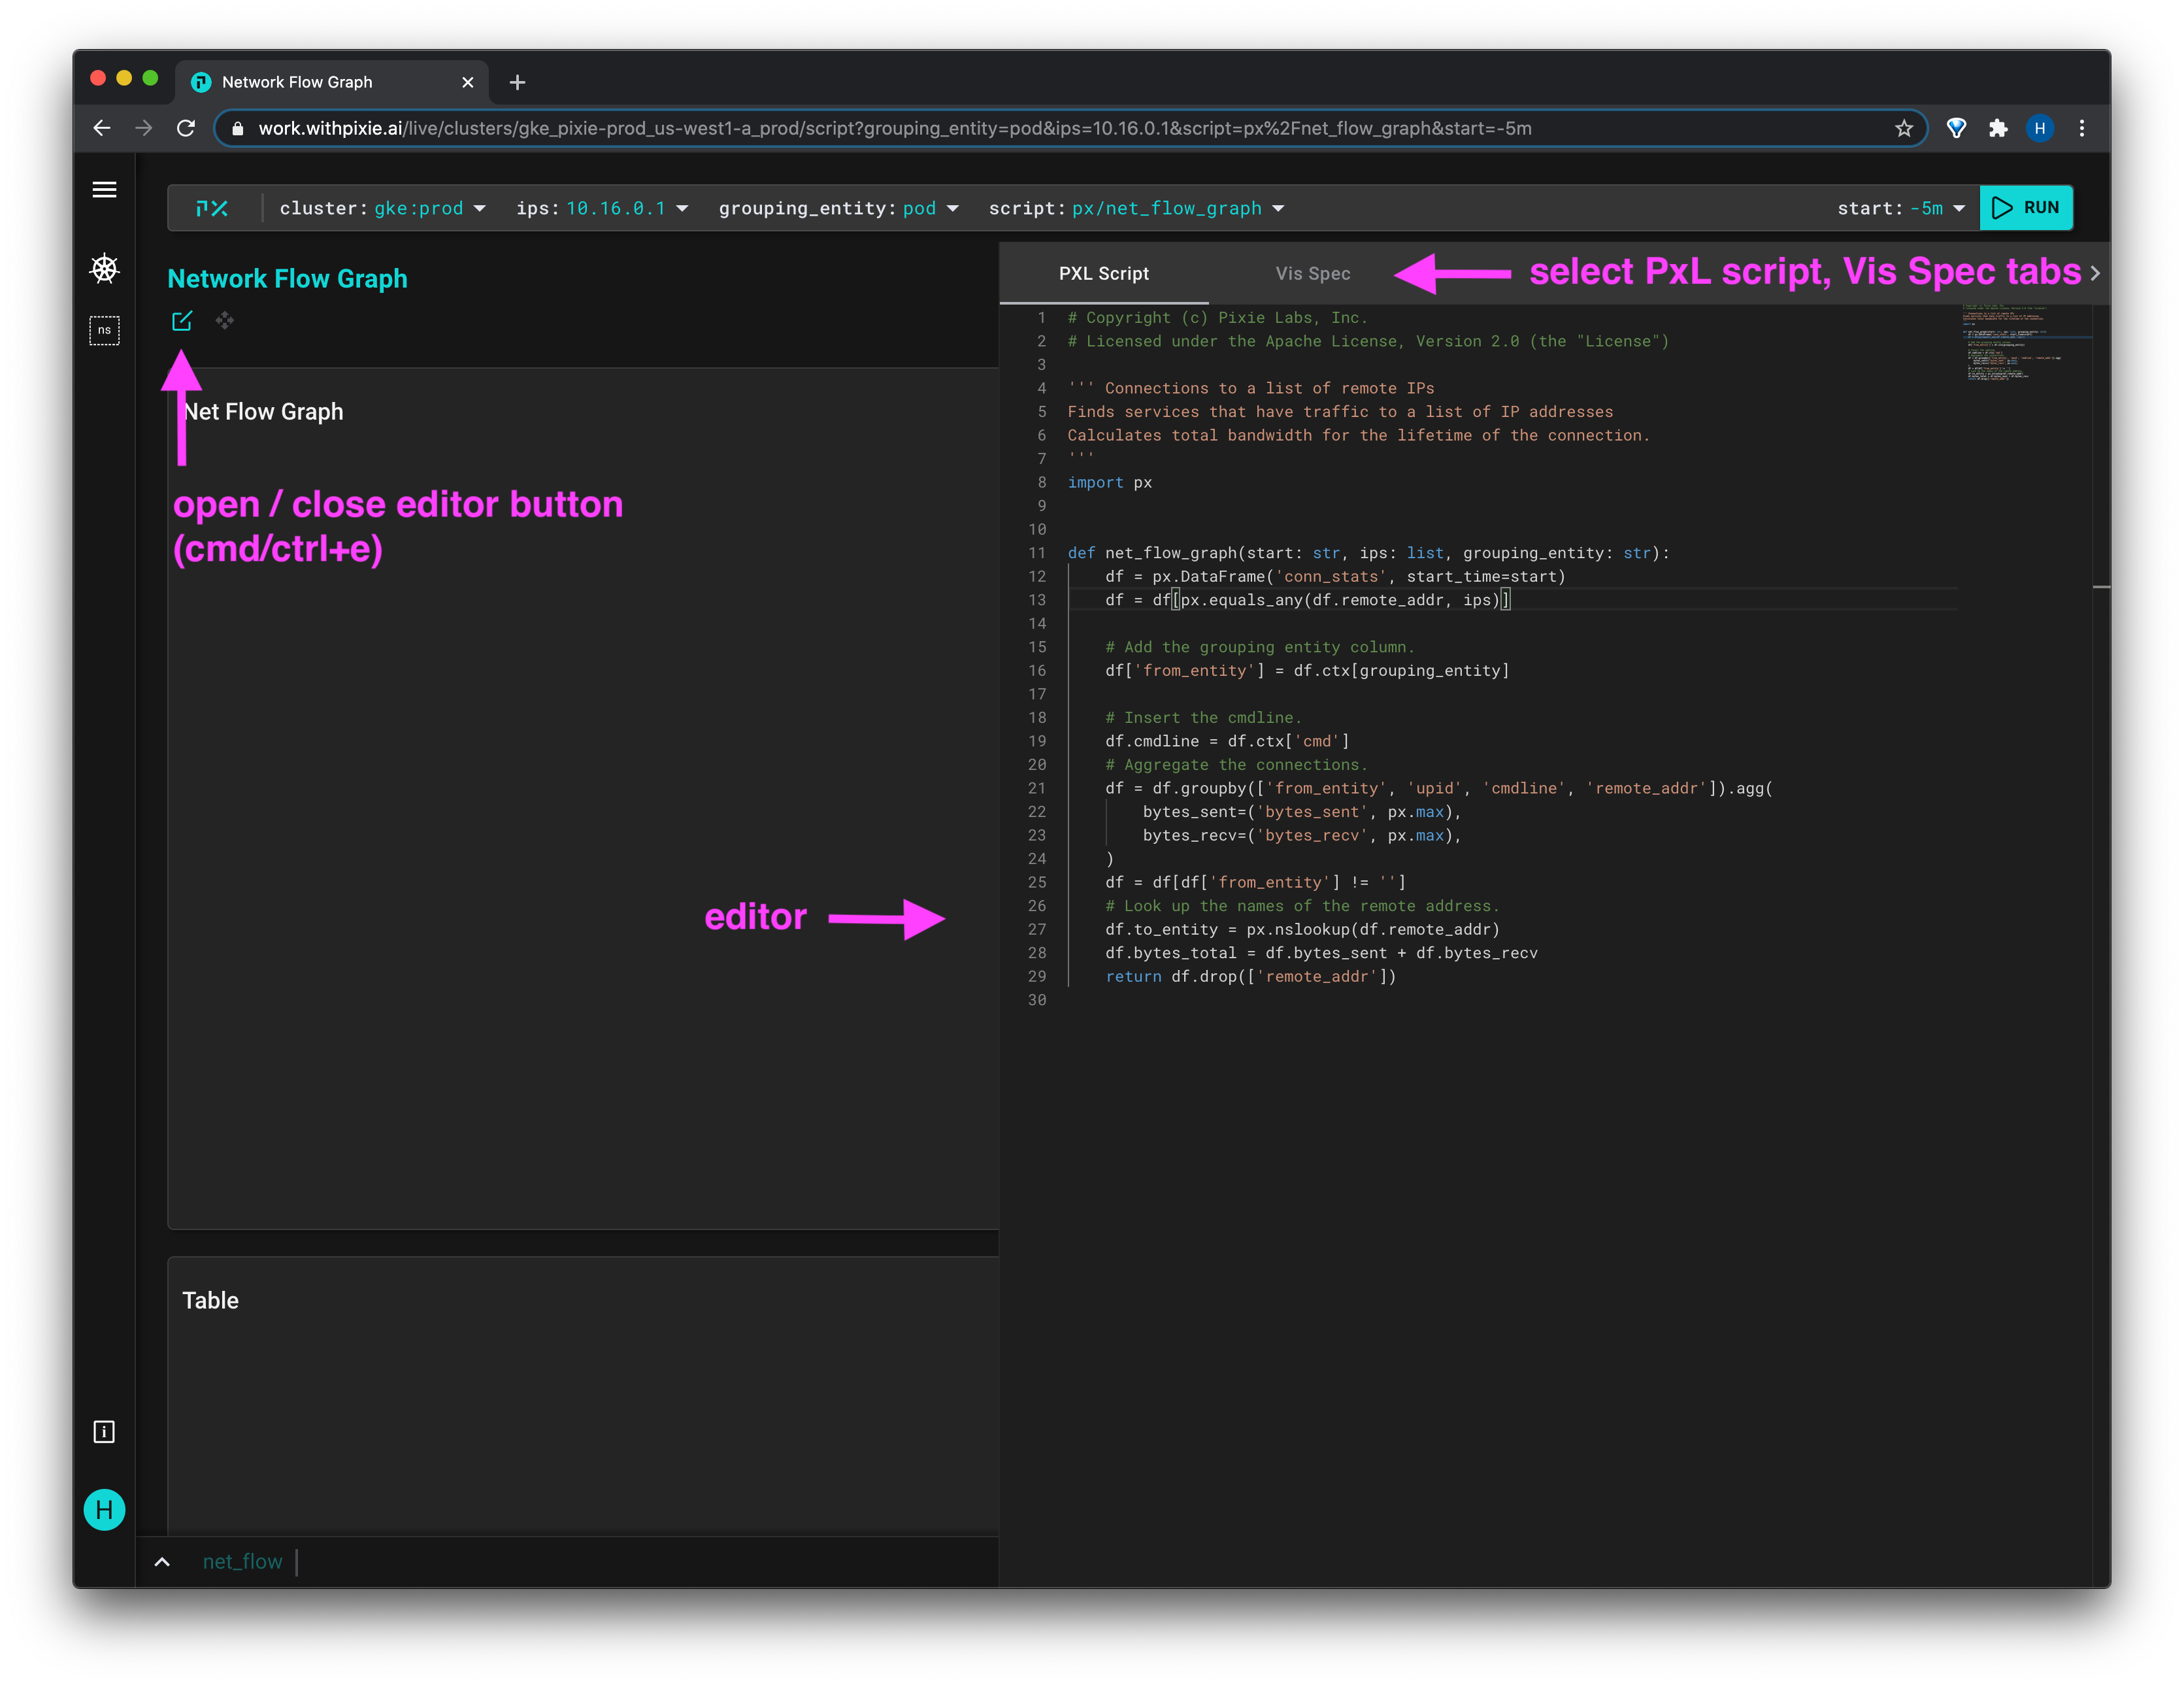
There are two parts to every Pixie Live View:
- The PxL script defines how to query and manipulate the data.
- The Vis Spec describes how to display the data.
Pixie's scripts are written using the Pixie Language (PxL), a domain-specific language that is heavily influenced by Pandas, a popular Python data processing library.
1import px234def net_flow_graph(start: str, ips: list, grouping_entity: str):5 df = px.DataFrame('conn_stats', start_time=start)6 df = df[px.equals_any(df.remote_addr, ips)]78 # Add the grouping entity column.9 df['from_entity'] = df.ctx[grouping_entity]1011 # Insert the cmdline.12 df.cmdline = df.ctx['cmd']13 # Aggregate the connections.14 df = df.groupby(['from_entity', 'upid', 'cmdline', 'remote_addr']).agg(15 bytes_sent=('bytes_sent', px.max),16 bytes_recv=('bytes_recv', px.max),17 )18 df = df[df['from_entity'] != '']19 # Look up the names of the remote address.20 df.to_entity = px.nslookup(df.remote_addr)21 df.bytes_total = df.bytes_sent + df.bytes_recv22 return df.drop(['remote_addr'])
To build the Network Flow Graph PxL script:
The
conn_stats(or connection stats) table contains all of the data that Pixie has gathered about network transactions sent and received from pods within your cluster. The full set of data that is available within theconn_statstable can be seen by running thepx/schemasscript.On line
5, we create a 2DDataFramedata structure populated with data from theconn_statstable that was collected after thestart_timescript input variable.On line
6, we filter the table data to only include connections whoseremote_addrmatch the IP(s) specified in theipsscript input variable.This script takes in a 3rd variable: the
grouping_entity, which allows the connections in the output to be aggreggated bypod,serviceor for a much higher-level view, bynamespace. The default grouping entity is thepod.The
.ctxfunction provides extra context based on the existing information in your DataFrame. In this case, because theconn_statstable contains the upid (an opaque numeric ID that globally identifies a process running inside the cluster), we can infer the pod name, namespace, and the command that initiated the connection. We add two columns to our DataFrame with this contextual information: on line9we add afrom_entitycolumn and on line12, we create another column calledcmdline.On line
14, we group the network connections in the table data by grouping entity, process id, cmdline, and IP address, summing their bytes sent and received.On line
18, we remove any data in which the IP address is unknown.On line
20we create a new column that sums the bytes sent and received.On line
22we return the dataframe, dropping the remote address column first (this column is the list of IP(s) that we filtered by).
The Vis Spec is a json file that describes how the PxL script should be provided input, excecuted, and rendered. A Vis Spec has 3 components:
variableslists the variables that should show up as interactive drop-down menu items in the UI.globalFuncslists the functions defined in the PxL script with the input variables required by those functions.widgetslists the actual UI units (tables, graphs, etc) displayed within a Live View, their physical positions relative to each other, and more detailed information required to configure the widget.
1{2 "variables": [3 {4 "name": "ips",5 "type": "PX_STRING_LIST",6 "description": "The IP addresses you wish to get the network flow into.",7 "defaultValue": "10.16.0.1"8 },9 {10 "name": "start",11 "type": "PX_STRING",12 "description": "The start time of the window in time units before now.",13 "defaultValue": "-5m"14 },15 {16 "name": "grouping_entity",17 "type": "PX_STRING",18 "description": "The k8s object to group connections by.",19 "defaultValue": "pod"20 }21 ],22 "globalFuncs": [23 {24 "outputName": "net_flow",25 "func": {26 "name": "net_flow_graph",27 "args": [28 {29 "name": "start",30 "variable": "start"31 },32 {33 "name": "ips",34 "variable": "ips"35 },36 {37 "name": "grouping_entity",38 "variable": "grouping_entity"39 }40 ]41 }42 }43 ],44 "widgets": [45 {46 "name": "Net Flow Graph",47 "position": {48 "x": 0,49 "y": 0,50 "w": 12,51 "h": 452 },53 "globalFuncOutputName": "net_flow",54 "displaySpec": {55 "@type": "pixielabs.ai/pl.vispb.Graph",56 "adjacencyList": {57 "fromColumn": "from_entity",58 "toColumn": "to_entity"59 },60 "edgeWeightColumn": "bytes_total",61 "edgeHoverInfo": [62 "bytes_total",63 "bytes_sent",64 "bytes_recv"65 ]66 }67 },68 {69 "name": "Table",70 "position": {71 "x": 0,72 "y": 4,73 "w": 12,74 "h": 475 },76 "globalFuncOutputName": "net_flow",77 "displaySpec": {78 "@type": "pixielabs.ai/pl.vispb.Table"79 }80 }81 ]82}
To build the Network Flow Graph Vis Spec:
lines
2-21list the drop-down menu variables available in the UI for this script (ips,start,grouping_entity), along with their types, description and defualt values.lines
22-43list thenet_flow_graphfunction defined in the PxL script that will provide data to both widgets, along with the variable inputs the function takes.lines
44-81list the widgets seen in the Live View output. In this script we have a graph positioned above a table. Both widgets pull data from thenet_flowfunction defined in theglobalFuncslist. The table is of thepl.vispb.Tabletype and requires no futher setup. Thepl.vispb.Graphgraph is setup to display anedgeWeightColumnto weight the graph edges bybytes_total. We've also addededgeHoverInfoto show display certain information when hovering over the graph's edges.